Electrolyser performance, with the uncertainty quantified.
HYDRA OS turns test and operating data into P10/P50/P90 estimates of efficiency, degradation and stack life, from short stack to full stack and from steady-state test to real operation. These are numbers lenders, insurers and independent engineers can build a business case on.
Cell voltage decides how much of it each kilogram costs.
0.27 kWh/kg2additional electricity per kilogram of hydrogen for every 10 mV of cell voltage
≈ €384,000/yr3the cost of 20 mV at a 10,000 t/yr plant at €70/MWh. Derived, illustrative
Uncertainty is the real risk
A low figure can be priced. An uncertain one can't.
When evidence is thin, investors hesitate or assume the worst, sometimes planning stack replacements years earlier than the manufacturer expects.
Thin evidence means short stacks, steady-state tests, and months of data rather than years.
Representative by design
Three gaps between the test and the plant.
Scale-up. From short stack to full stack, including shunt currents in alkaline designs and current and thermal distribution.
Operating profile. From steady-state testing to fluctuating renewable operation, start/stop cycles and standby.
Time. From months of data to project lifetime: stabilisation, linear or accelerating degradation, with explicit scenario weights.
Physics you can inspect
Every millivolt has a physical cause.
Our electrochemical engine separates cell voltage into its contributions. Every output traces to a measurement, an equation and an uncertainty.
1.23 V0.300.25
Reversible voltageAnode activationCathode activationOhmic lossesMass transportIllustrative PEM cell, high current density5
HYDRA OS at cell level
Every millivolt, attributed.
HYDRA OS separates each cell's voltage into kinetic, ohmic and transport losses and tracks each one over time. Catalyst loss, membrane ageing and transport limits stop hiding inside a single stack voltage.
Kineticrising
Ohmicstable
Transportstable
Illustrative data
HYDRA OS at cell level
Degradation as a distribution, not a guess.
From short-stack and steady-state evidence, HYDRA OS estimates how your cells will age at full scale and on your operating profile, as P10, P50 and P90, and states whether the trend looks linear or accelerating.
Illustrative data
HYDRA OS at cell level
What each kilogram really costs.
Cell-level losses roll up into specific energy consumption, stack life and degradation-adjusted LCOH, each as a range with its sources, and with the evidence that would narrow it most.
Specific energy
Stack life
LCOH
P10 to P90 P50
Illustrative data
From physics to evidence
Evidence your reviewers can check.
Reports structured the way independent engineers review them: KPIs on recognised definitions, an uncertainty budget, and every figure traced to its source.
A low figure can be priced. An uncertain one can't.
When evidence is thin, investors hesitate or assume the worst, sometimes planning stack replacements years earlier than the manufacturer expects. Thin evidence here means short stacks, steady-state tests, and months of data rather than years. HYDRA OS quantifies the uncertainty, shows where it comes from, and identifies the evidence that would reduce it.
Scale-up
From short stack to full stack, including shunt currents in alkaline designs and current and thermal distribution.
Operating profile
From steady-state testing to fluctuating renewable operation, start/stop cycles and standby.
Time
From months of data to project lifetime: stabilisation, linear or accelerating degradation, with explicit scenario weights.
P10/P50/P90 performance, degradation and stack-life estimates from your test or operating data, with scale-up, operating-profile translation and an uncertainty budget. Available as an Evidence Pack for OEMs, or as TDD Support for developers and owners.
HYDRA Verify
Acceptance-test and guarantee verification, corrected to guarantee conditions, with a stated uncertainty and a clear verdict.
HYDRA Monitor
Continuous on-premise, read-only monitoring that narrows the uncertainty band as operating data accrues. Also covers data quality, early warning and stack planning.
HYDRA Review
The toolkit for independent engineers, lenders and insurers reviewing electrolyser performance.
From operating data to performance evidence.
Connect
Start with an export from your historian: no installation, no connection to your plant. For continuous monitoring, HYDRA OS reads data over OPC UA, Modbus or MQTT. It is read-only, on-premise, and never writes to control or safety systems.
Normalise and attribute
Our electrochemical engine checks data quality, finds steady-state operating windows, corrects to reference conditions and separates cell voltage into its physical contributions. Every output traces to a measurement, an equation and an uncertainty.
Evidence
You receive P10/P50/P90 estimates, KPIs on recognised definitions, an uncertainty budget, guarantee verdicts and the evidence that would most reduce the remaining uncertainty, in reports structured the way independent engineers review them. Language models may help draft the text. They never make the call.
We don't build electrolysers.
Polestar makes no electrolysers, stacks or components, and takes no commission from those who do. HYDRA OS is OEM-agnostic and works alongside your OEM's monitoring and service. That independence is the product.
Our commitments
No hardware sales.
No supplier commissions.
No writes to control or safety systems.
No use of customer data beyond the engagement.
No published figure without a source.
Built on recognised frameworks.
Our KPI definitions follow the conventions of DNV-RP-J302, Performance and testing of electrolyser systems. Our approach to model assurance references DNV's recommended practices on digital-twin and data-driven model assurance. Every tool on this site runs the same engine as HYDRA OS, with its method written out.
CitedClean Hydrogen Partnership, Clean Hydrogen JU SRIA: technology KPIs, state of the art 2020. Reference definitions vary between technologies. Last verified 26 September 2026.
IllustrativeIndicative breakdown of a PEM water-electrolysis cell at high current density: reversible ≈ 1.23 V, activation ≈ 0.3–0.4 V, ohmic ≈ 0.2–0.3 V, mass transport ≈ 0.05 V, total ≈ 1.8–2.0 V. Not a measurement of any product.
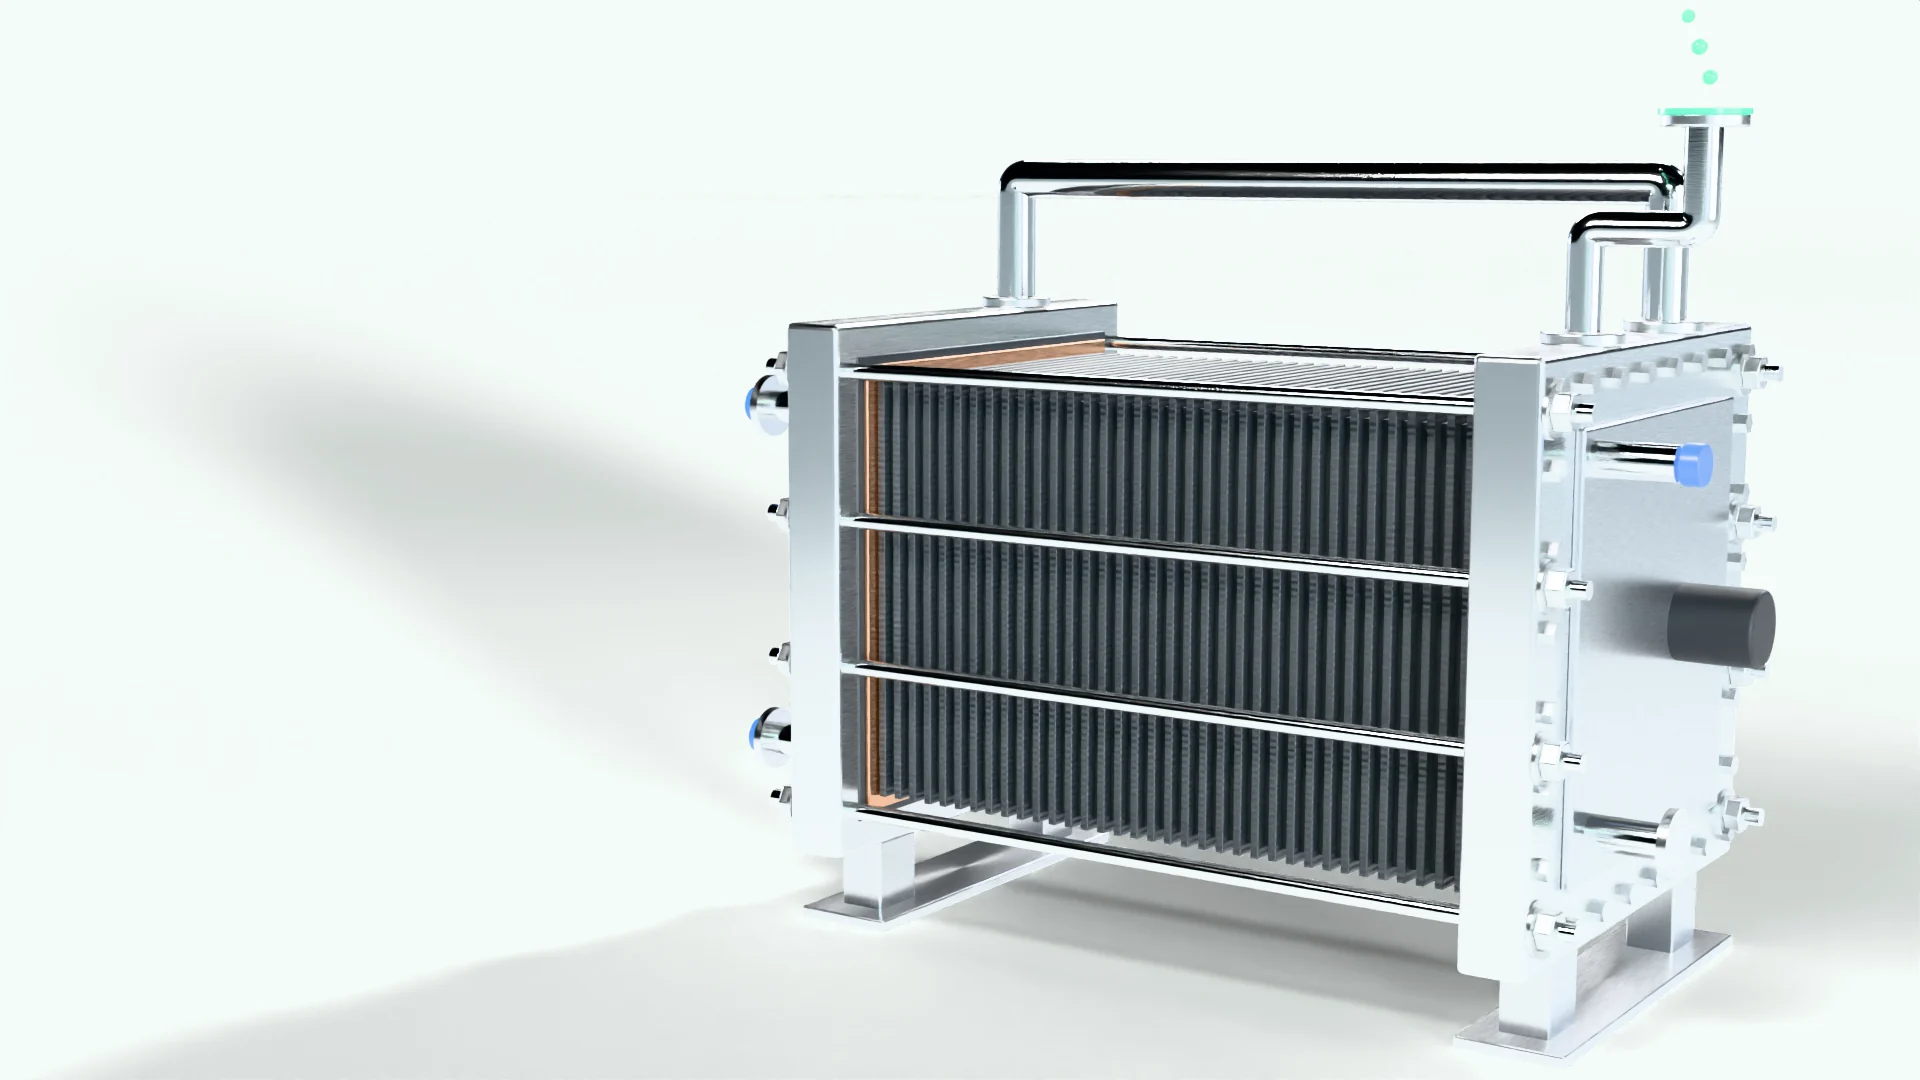
RenderThe stack and the molecular scene above are generic illustrations modelled for this site. They do not depict any manufacturer's product.
 Polestar