AWE · PEM · SOEC
Three technologies. One physics.
Alkaline, PEM and solid oxide cells age in different ways. The same electrochemistry describes all three, so one engine can read them all.
 Polestar HYDRA OS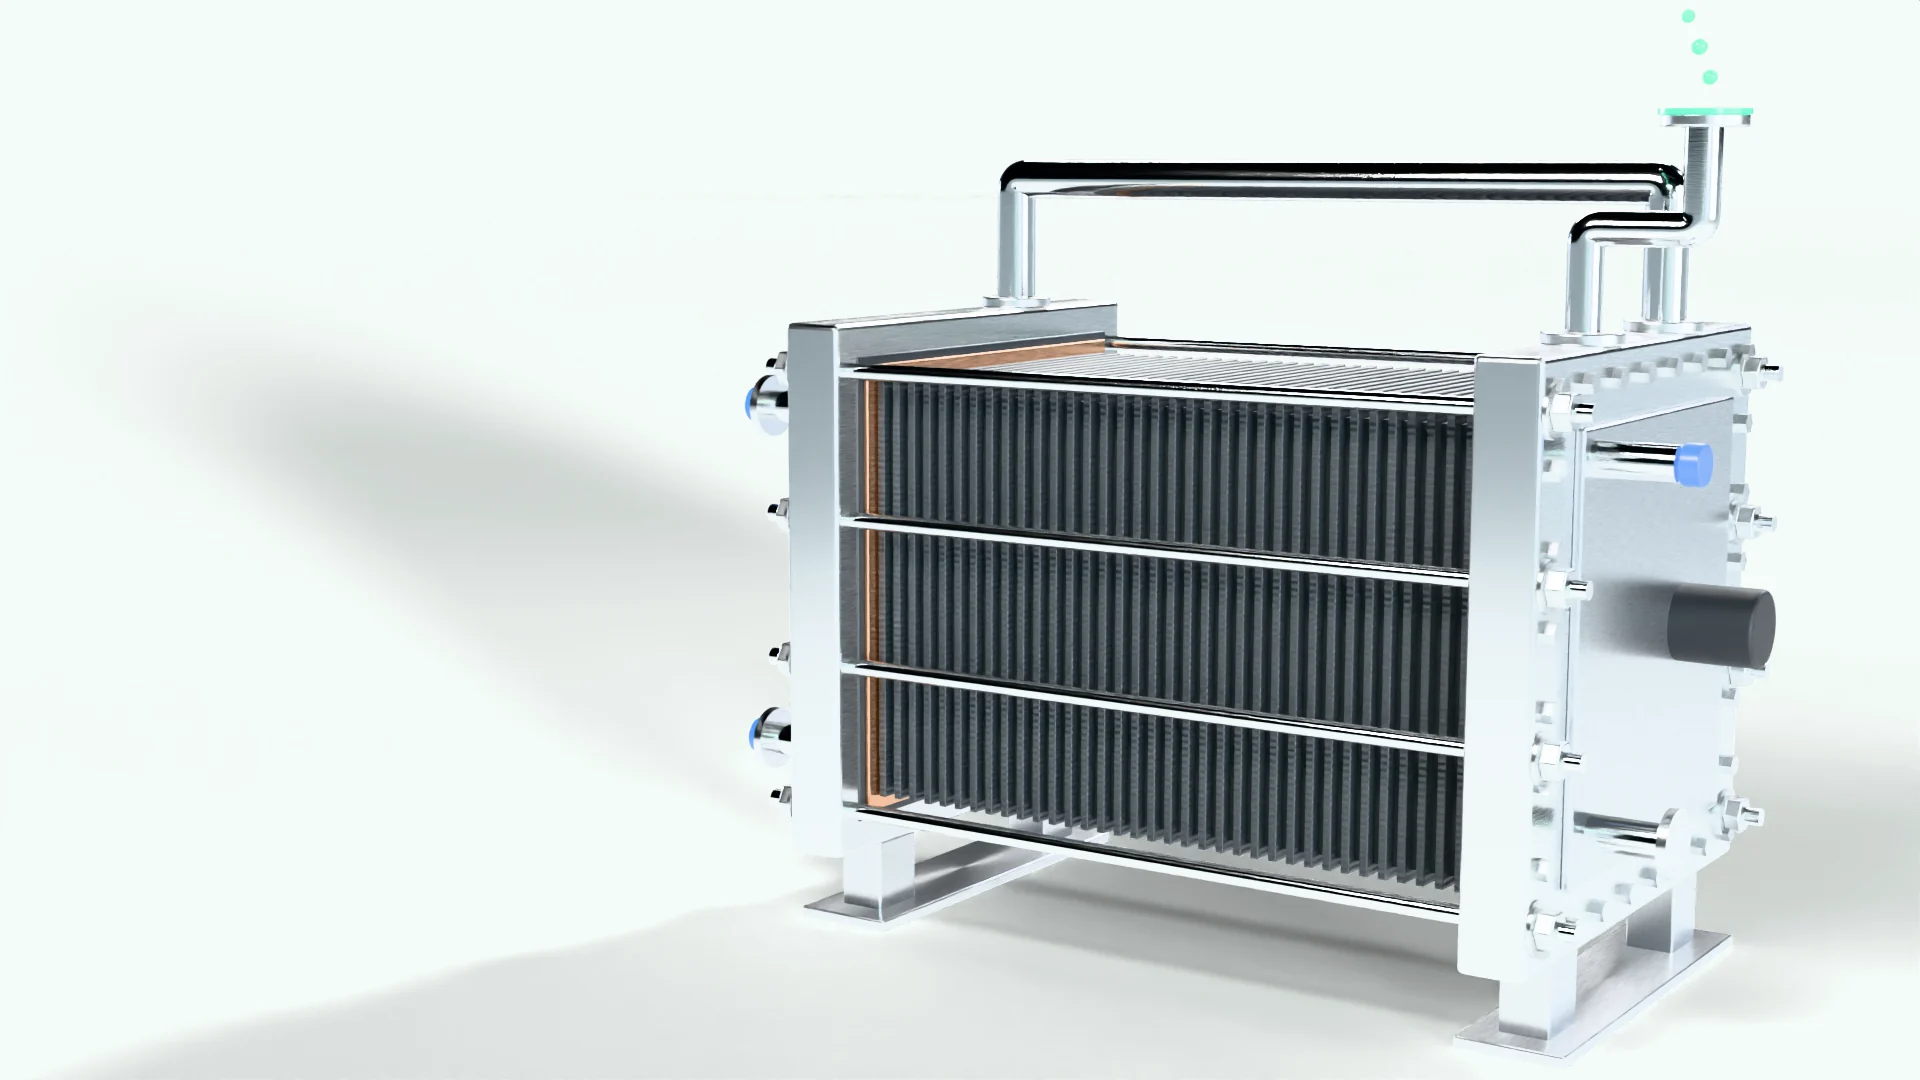
AWE · PEM · SOEC
Alkaline, PEM and solid oxide cells age in different ways. The same electrochemistry describes all three, so one engine can read them all.
Inside the stack
Plates, porous transport layers, catalyst layers and the membrane or separator. Each ages by its own mechanism, and each leaves its own signature in the data.
What HYDRA OS reads
HYDRA OS reads the leading indicator of each mechanism, so a change is attributed to its cause rather than averaged into one stack voltage.
Continue to the pageThe most deployed technology at scale. Large cells and long stacks make scale-up and shunt currents the central evidence questions.
| Degradation mechanism | Consequence for the stack | Leading indicator HYDRA OS reads |
|---|---|---|
| Potassium hydroxide corrosion of separators and electrodes | Increasing ohmic loss; separator embrittlement | Ohmic slope change in the polarisation curve |
| Gas purity at low load | Crossover stays roughly constant while production falls, so the share of H₂ in O₂ rises towards the safety limit | H₂-in-O₂ concentration against load |
| Reverse currents during shutdown | Electrode degradation that accumulates with start/stop cycles | Activation overpotential change after shutdown events |
| Shunt currents through the electrolyte manifolds | Current lost to parasitic paths; uneven cell loading in long stacks | Faradaic efficiency and cell-voltage spread along the stack |
Compact and responsive to fluctuating power. Membrane and anode-catalyst ageing under dynamic operation are the main evidence questions.
| Degradation mechanism | Consequence for the stack | Leading indicator HYDRA OS reads |
|---|---|---|
| Membrane thinning and pinholing under dynamic load | Rising hydrogen crossover into the oxygen stream; eventual safety trip | H₂-in-O₂ concentration rising at fixed load; fluoride emission rate in the product water |
| Catalyst layer delamination | Loss of active area; irreversible efficiency loss | Cell-level voltage divergence within the stack |
| Iridium dissolution and OER catalyst degradation | Rising anode overpotential at constant current | Voltage shift in the low-current (kinetic) region at reference conditions |
| Titanium PTL passivation and cation contamination of the membrane | Rising ohmic loss | Area-specific resistance (ohmic slope) at reference conditions |
High efficiency with heat integration. Thermal cycling and electrode microstructure changes dominate degradation.
| Degradation mechanism | Consequence for the stack | Leading indicator HYDRA OS reads |
|---|---|---|
| Thermal cycling stress and interconnect oxidation | Seal failure, delamination at the electrode–electrolyte interface | Degradation rate tracked against cumulative thermal cycles |
| Nickel migration and agglomeration in the fuel electrode | Loss of active sites and rising polarisation resistance | Polarisation resistance trend (impedance, where available) |
| Degradation mechanism | Consequence for the stack | Leading indicator HYDRA OS reads |
|---|---|---|
| Cumulative area-specific resistance growth from combined mechanisms | Energy per kilogram of hydrogen climbs over project life, raising LCOH | Cell voltage at a fixed reference current density |
AEM. Anion exchange membrane electrolysis: research.
Send us an export. Our team returns verified KPIs, degradation rates and a clear view of where your voltage goes.